Group: Wellbeing Continuum
Click to view full screen…
This report shows how children's scores in your group are distributed across three wellbeing bands for each domain, revealing the proportion of scores that fall into the Strong, Coping, or Struggling range.
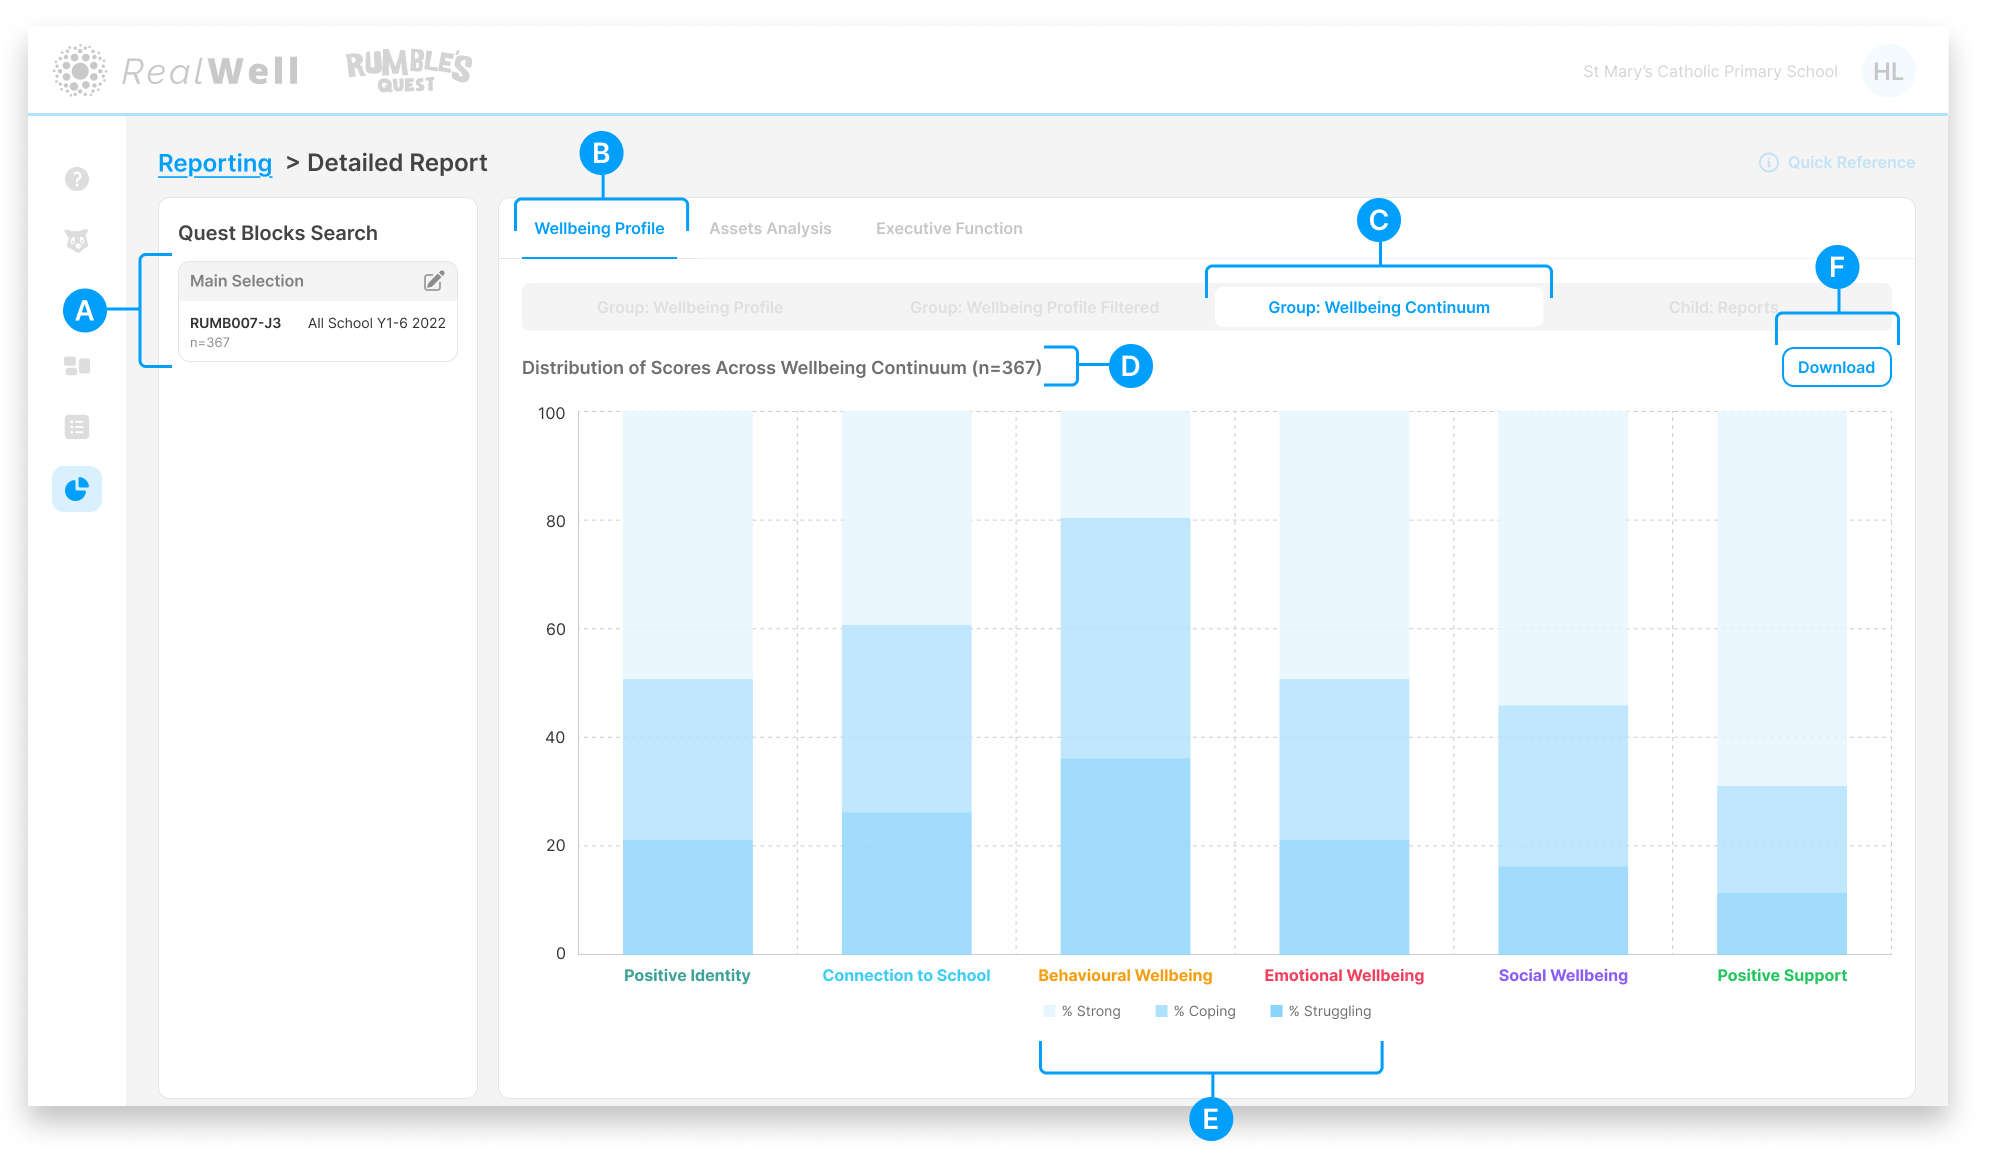
(A) Quest Blocks Search — The Quest Block(s) and sample size for this report. Your selection represents the data collection period you're reporting on.
(B) Wellbeing Profile — The active reporting group
(C) Group: Wellbeing Continuum report tab — The active report
(D) Sample size — Displays the number of children included, e.g. "Group Wellbeing Continuum (n=367)"
(E) Legend — Defines the three bands: % Strong, % Coping, % Struggling
(F) Download — Download the chart and associated scores as a PDF
Reading the Continuum
Each domain is shown as a stacked bar, with three bands representing the distribution of children's scores across the wellbeing continuum.
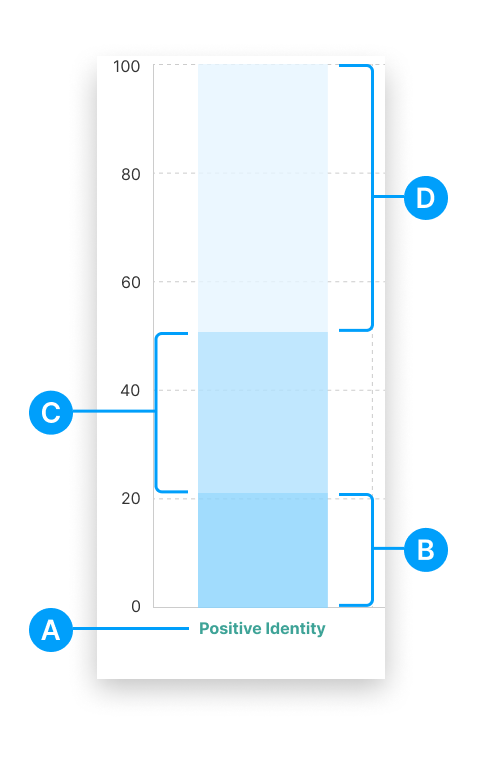
(A) Domain label — The wellbeing domain name
(B) % Struggling — The darkest band (bottom of the bar). Children in this band are showing signs of difficulty in this domain.
(C) % Coping — The middle band. Children in this band are managing but may benefit from support.
(D) % Strong — The lightest band (top of the bar). Children in this band are demonstrating strength in this domain.
The continuum view is particularly useful for understanding the overall distribution within your group. A high median score can sometimes mask a meaningful number of children who are struggling, so this view complements the Group Wellbeing Profile.