Item Analysis
Click to view full screen…
This report drills down to the individual question level. Questions are grouped within their asset, and assets within their wellbeing domain, so you can explore the data from domain level right through to individual items. For each question, you can see the group's mean response and how answers were distributed across Low, Medium, and High response categories, compared against the broader population.
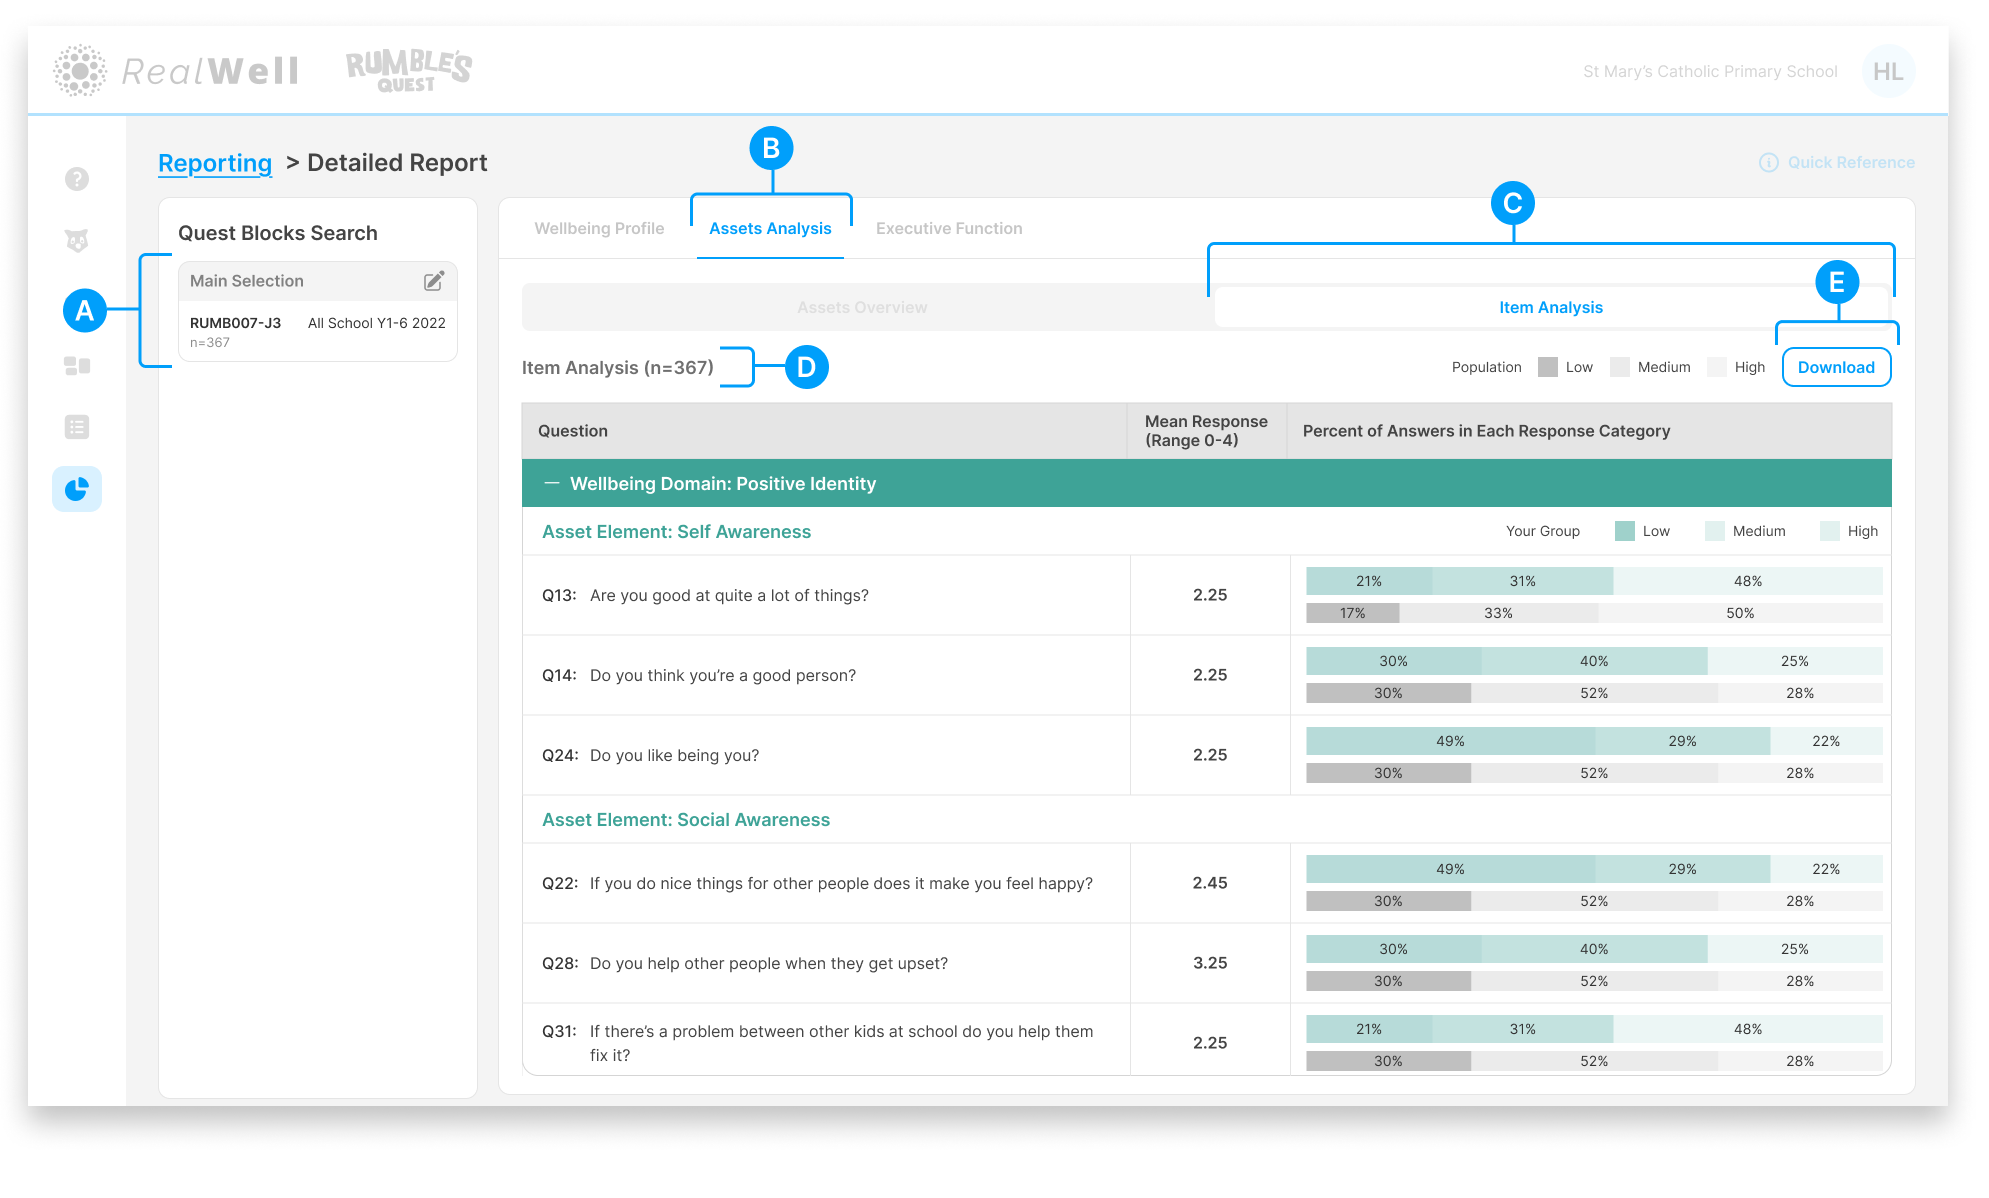
(A) Quest Blocks Search — The Quest Block(s) and sample size for this report. Your selection represents the data collection period you're reporting on.
(B) Assets Analysis — The active reporting group
(C) Report tabs — Item Analysis is the active report tab
(D) Sample size — The number of children included, e.g. "Item Analysis (n=367)"
(E) Download — Download the chart and associated scores as a PDF
Reading the Item Analysis
The report is organised in a hierarchy: Wellbeing Domain (teal header) > Asset Element (teal subheading) > individual questions. Each question includes a mean response score and a pair of horizontal bars comparing your group's response distribution against the population.
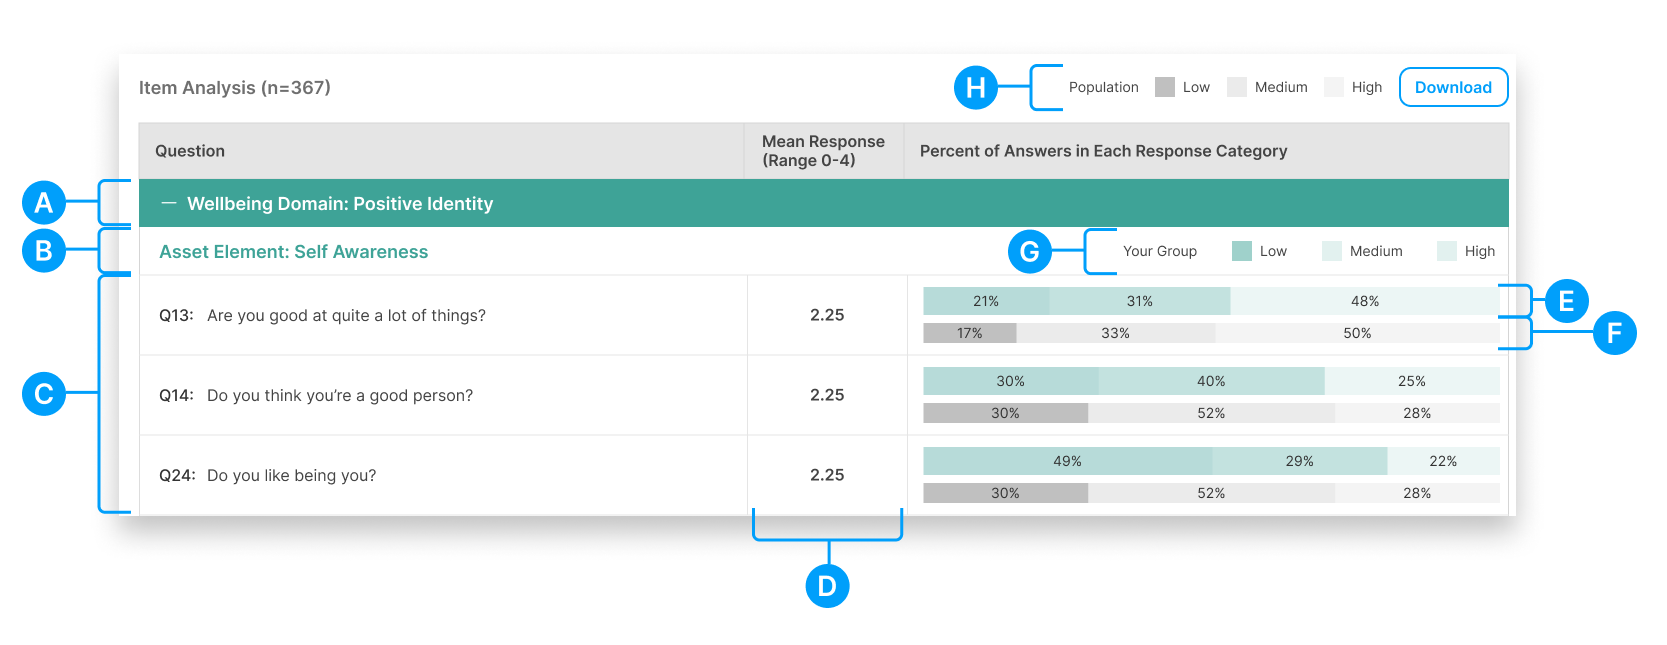
(A) Wellbeing Domain — The teal header grouping all assets and questions for that domain
(B) Asset Element — The asset name, shown as a subheading beneath its parent wellbeing domain
(C) Questions — The individual questions that make up each asset, listed with their question number
(D) Mean Response — The group's average response to each question on a 0–4 scale
(E) Your Group bar — A horizontal bar showing the percentage of your group's answers that fell into Low, Medium, and High response categories
(F) Population bar — A matching bar showing the population's response distribution for comparison
(G) Your Group legend — Defines the Low, Medium, and High bands for your group's bar (shown in colour)
(H) Population legend — Defines the Low, Medium, and High bands for the population bar (shown in grey)
Comparing your group's bar against the population bar for each question can highlight where your children's responses differ from the norm, both positively and in areas that may warrant further exploration.