Assets Overview
Click to view full screen…
A table showing all six wellbeing domains and the 13 assets that make up each one. Each domain and asset displays a group median score on a 0–100 scale, giving you a clear picture of where your group's strengths lie and which areas may need attention.
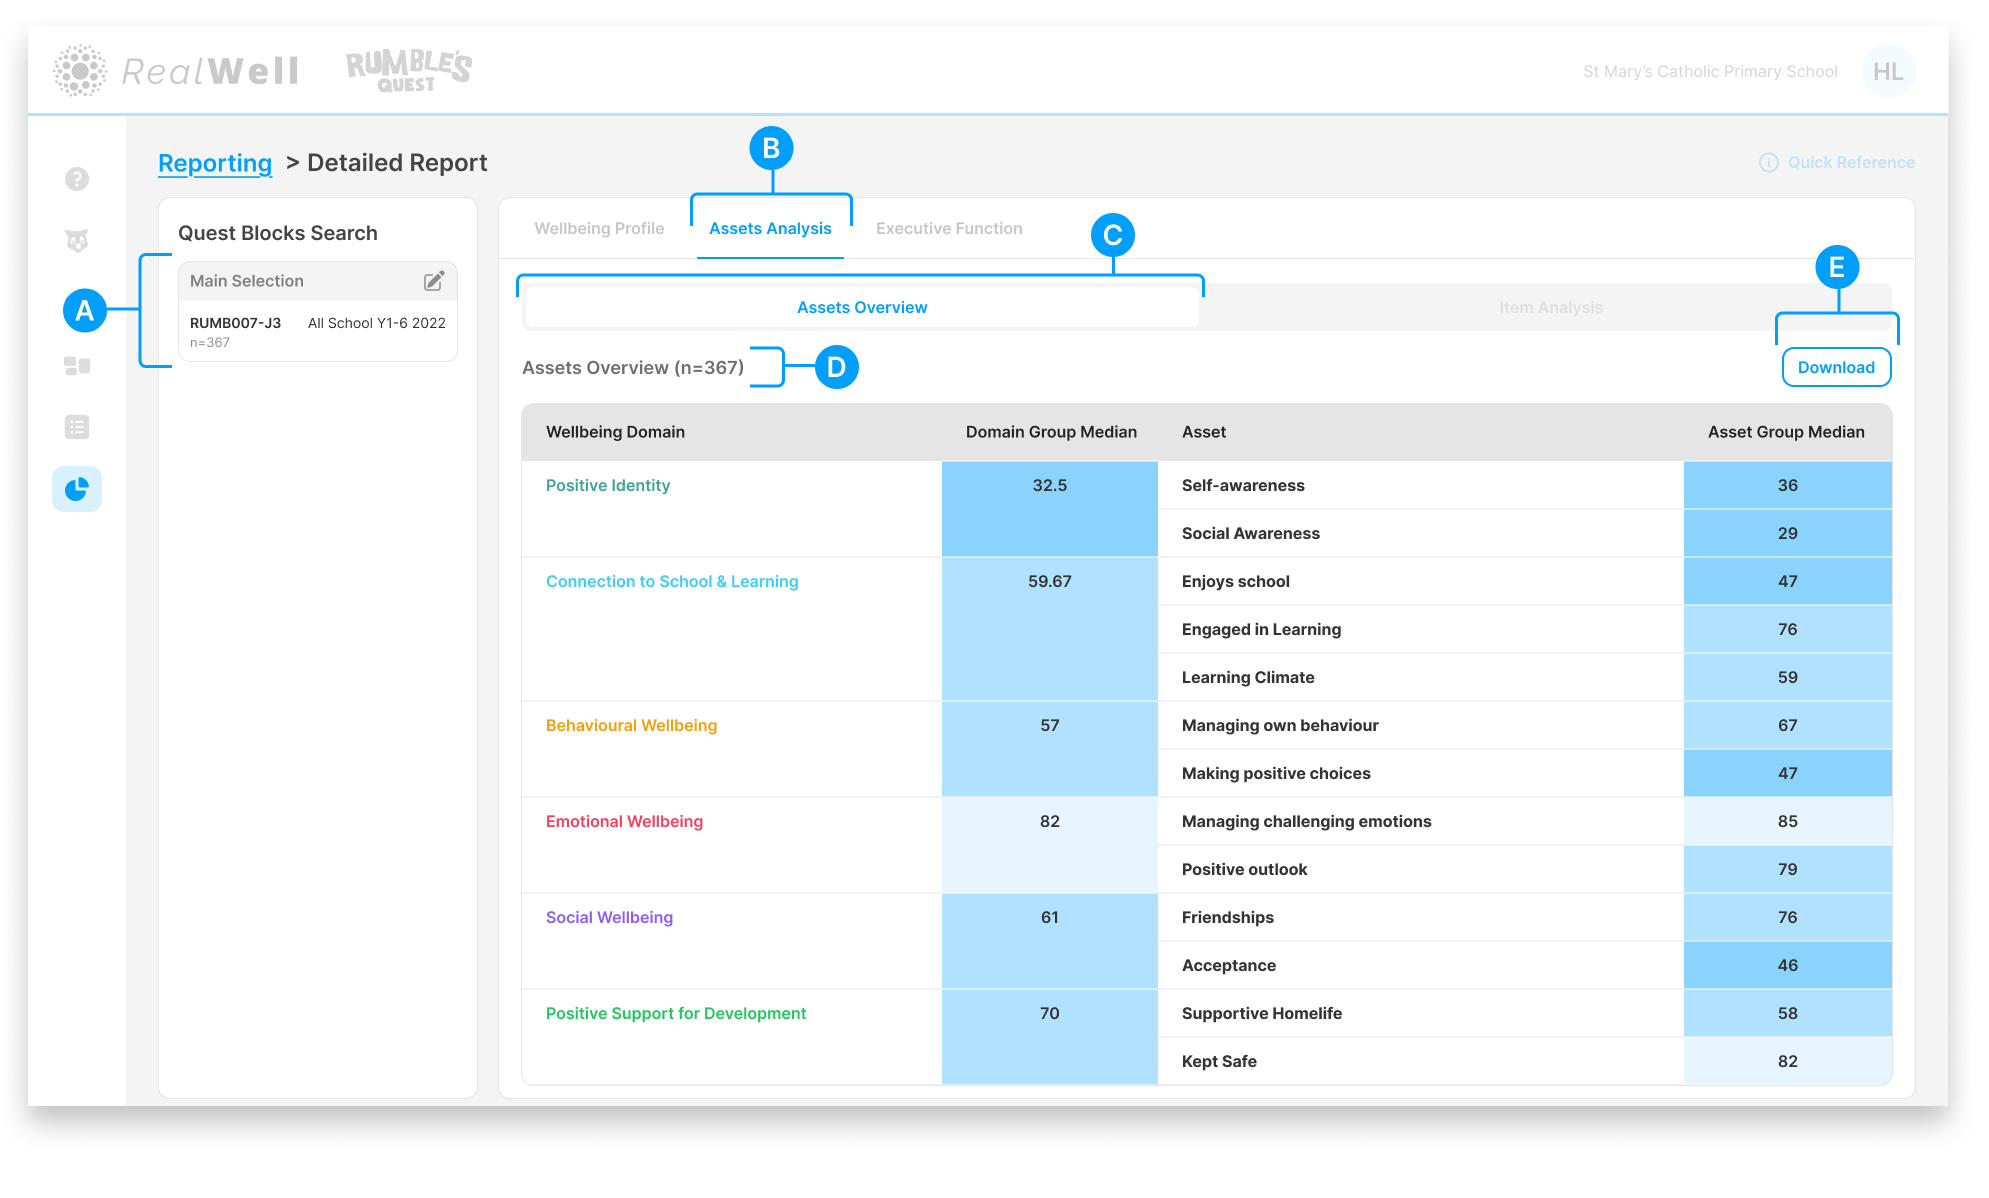
(A) Quest Blocks Search — The Quest Block(s) and sample size for this report. Your selection represents the data collection period you're reporting on.
(B) Assets Analysis — The active reporting group
(C) Report tabs — Assets Overview is the active report tab
(D) Sample size — The number of children included, e.g. "Assets Overview (n=367)"
(E) Download — Download the chart and associated scores as a PDF
Reading the Table
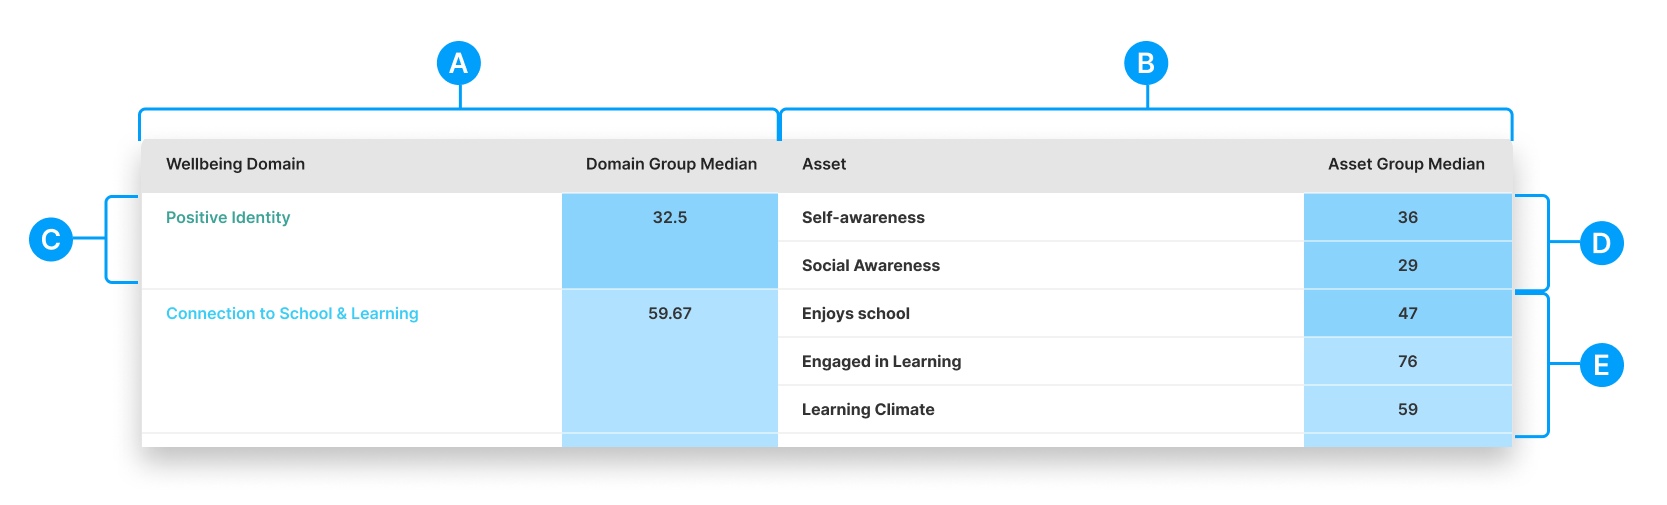
(A) Domain Group Median — The overall median score for each wellbeing domain, shown as a number with a proportional blue bar
(B) Asset column — The assets (subdomains) that make up each wellbeing domain
(C) Wellbeing Domain — The six domain names, colour-coded for easy reference
(D, E) Asset Group Median — The median score for each asset, grouped beneath its parent domain. Scores are colour-coded to the wellbeing bands: dark blue for Struggling, medium blue for Coping, and light blue for Strong.
The table is organised so that each domain's assets are grouped together. For example, Connection to School & Learning includes three assets: Enjoys School, Engaged in Learning, and Learning Climate. Comparing the asset medians within a domain can reveal where specific strengths or challenges sit.