
Group: Executive Function Summary Report
Click to view full screen…
This report shows how your group performed across the five executive function skills. Each skill is displayed as a bar chart showing the percentage of children at or above expected level versus below expected level, with your group's median and a population benchmark for comparison.
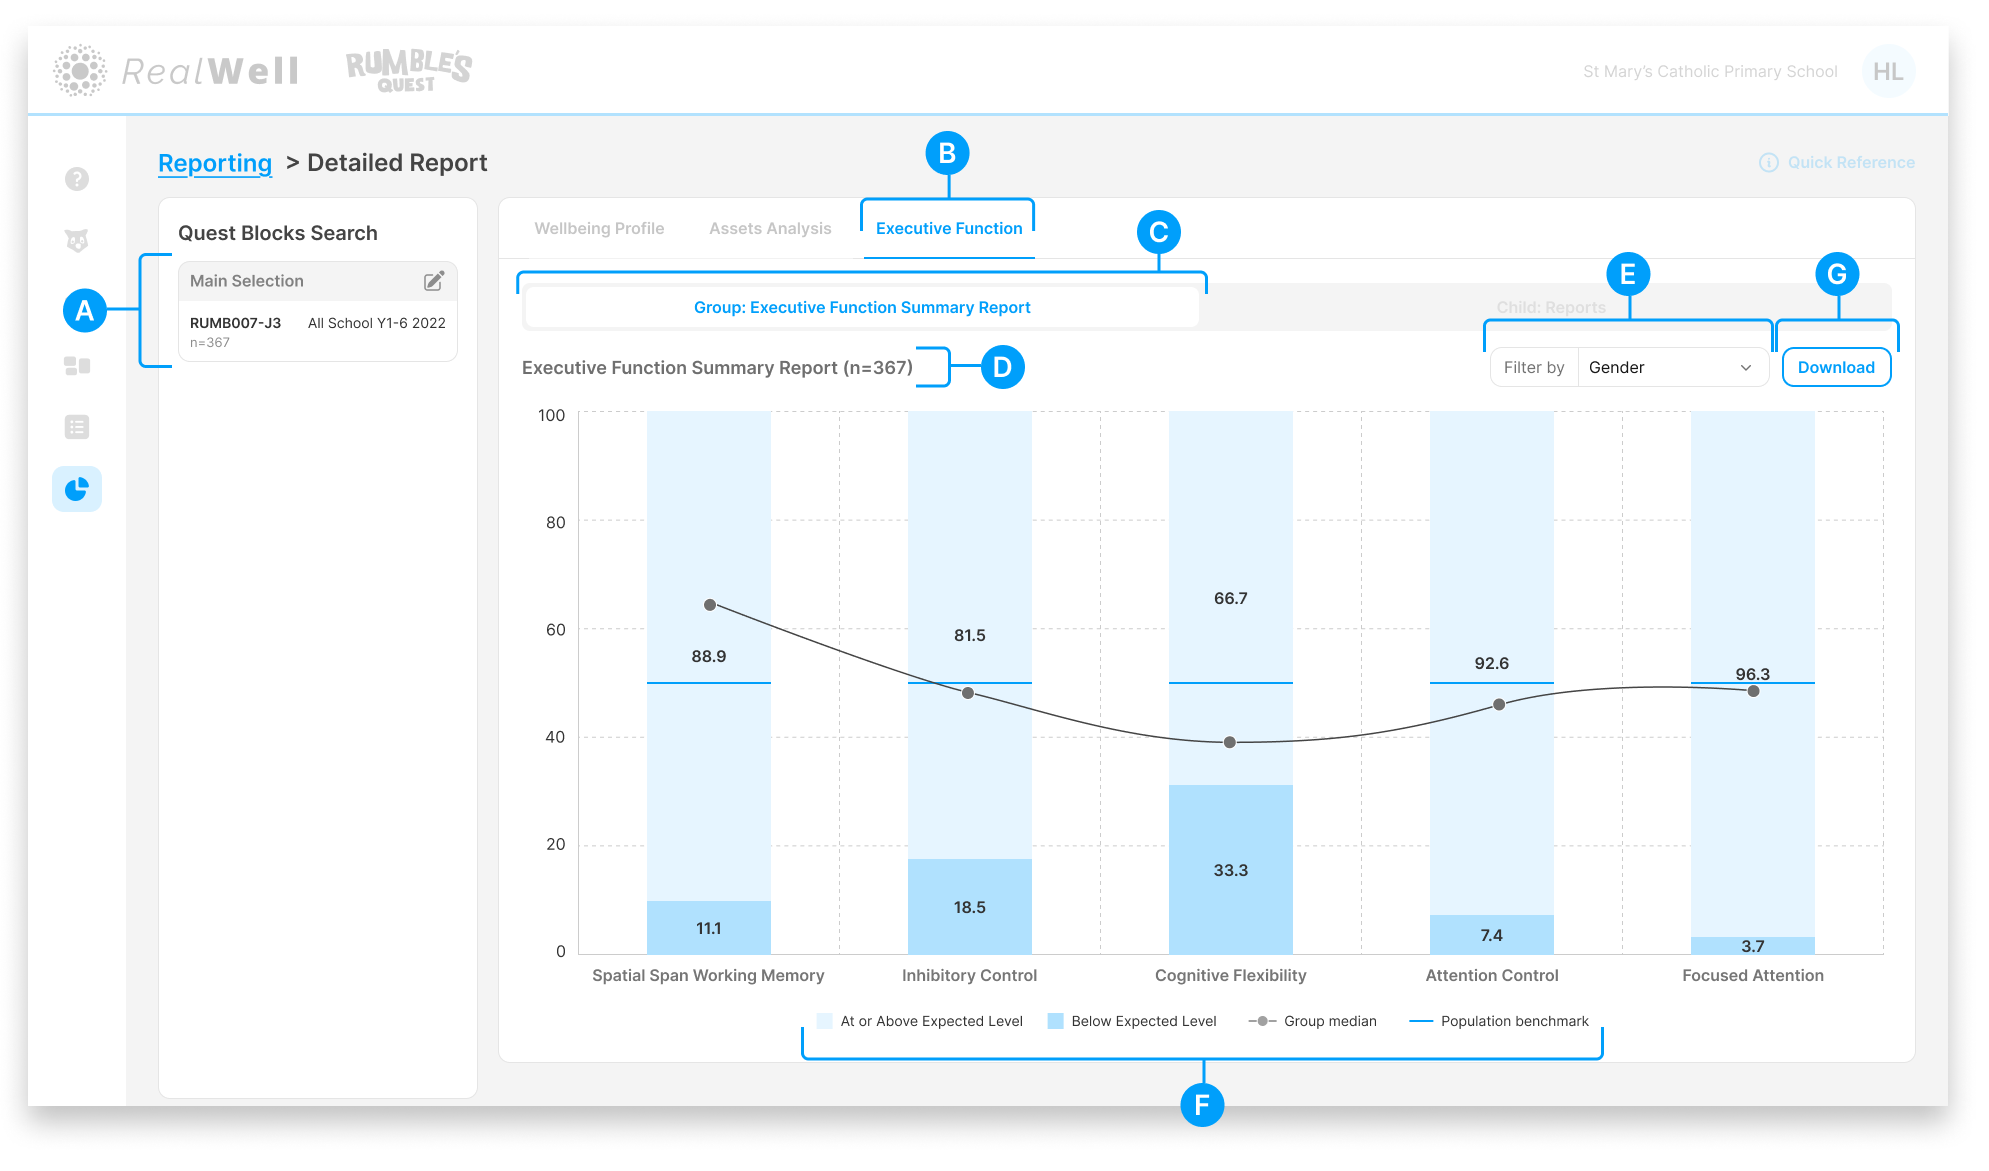
(A) Quest Blocks Search — The Quest Block(s) and sample size for this report. Your selection represents the data collection period you're reporting on.
(B) Executive Function — The active reporting group
(C) Report tabs — Group: Executive Function Summary Report is the active report tab
(D) Sample size — The number of children included, e.g. "Executive Function Summary Report (n=367)"
(E) Filter by — Filter the chart by demographic category to compare subgroups. Options include:
Grade
Group
Gender
First Nations Status
(F) Legend — Defines the chart elements: At or Above Expected Level, Below Expected Level, Group median, and Population benchmark
(G) Download — Download the chart and associated scores as a PDF
Reading the Chart
Each of the five executive function skills is shown as a vertical bar, split into two bands.
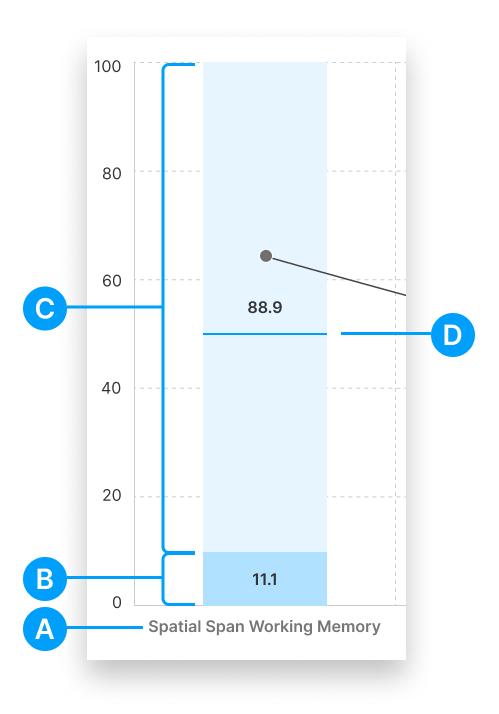
(A) Skill label — The executive function skill name
(B) Below Expected Level — The darker band at the bottom of the bar, showing the percentage of children scoring below the expected level for their age
(C) At or Above Expected Level — The lighter band at the top, showing the percentage at or above the expected level. The percentage is displayed on the bar.
(D) Population benchmark — A horizontal line showing the population benchmark for comparison
The group median is plotted as a dot connected across all five skills, giving you a sense of the overall executive function profile. When the Filter by dropdown is active, separate lines appear for each category so you can compare subgroup patterns.