Step 1: Explore Your Data
Click to view full screen…
Some people call having social and emotional competencies another form of fitness! This sort of fitness can enhance the quality of children's lives by exercising skills that prepare them to succeed rather than waiting for problems to emerge. Your data are a fitness indicator: What are they telling you about the kind of skills you can help children practice to build-up their wellbeing muscles?
1.1 Understanding the Reports
When reviewing your results, remember that the more you look the more you'll see! So, let's start with what you see straight up.
Your Rumble's Quest wellbeing data have been presented in two major sections:
Wellbeing Profiles
Assets Analyses
Take a systematic approach when exploring your results by working through each of these major sections in turn. Let the data lead you on a journey.
The best place to start is with the Group Wellbeing Profile.
Wellbeing is multi-faceted and is certainly not an all or nothing state. Rumble's Quest measures wellbeing across six core domains (Refer to What Rumble's Quest Measures and Why for details.) This allows results to be presented as a profile of wellbeing across all domains. The profile shows, at a glance, which areas are strong relative to others: where children are doing well and where they might benefit from additional support.
The Wellbeing Profile graph plots the group's median score on each of the 6 domains. It's a useful snapshot of overall wellbeing within the group (e.g., the whole school cohort).
Additional reporting features can then be applied within this section to help you build an even more nuanced and deeper level of understanding of wellbeing within the cohort:
The Compare To feature in the Group Wellbeing Profile section provides context. It lets you compare your group's results to some useful reference populations:
The Population Benchmark (national median range for each domain) shows the expected results based on a norming dataset that is demographically representative of the national population.
The Similar Schools Benchmark shows the median range for each domain based on data from schools with a similar socio-economic background (IRSD quintile) to the community where your school is located.
The Filter my Group Profile function gives you the power to view the profiles for distinct subgroups within your overall cohort. For instance, you can filter the group profile by gender or grade level. This lets you see separate profile lines for subgroups (e.g., boys and girls) so you can make some quick comparisons and scan for similarities and differences between the subgroups (e.g., does the shape of the profile change as children get older?).
The Wellbeing Continuum report shows the percentage of children in your group whose scores fall within three bands: Strong; Coping, Struggling. Looking at the way the group's wellbeing is distributed across the continuum on each domain extends the story your data began telling through the median scores. Read together, the median and the distribution along the continuum provide deeper insight into the group's wellbeing.
The Child Reports present the six wellbeing domain scores for each child who played. Essentially it represents the wellbeing profile on an individual rather than group level. Each value in every child's score profile is coloured with a shade that corresponds to the bands of the wellbeing continuum so you can quickly see the domains on which a child is Strong – Coping – or Struggling.
Once you have gone through all your Wellbeing Profile reports, it's time to move onto the Assets Analysis section.
The Assets Analysis is the second major section of Rumble's Quest reporting.
This section adds a more detailed layer of insight to the wellbeing profile. It shows the way each wellbeing domain is underpinned by a set of developmental assets. In total, 13 developmental Assets sit under the 6 wellbeing domains. Five domains are unpacked via 2 assets each, and the sixth domain is associated with 3 assets.
The Assets Analysis section includes functions to generate two types of reports:
The Assets Overview brings your results into clearer focus. It summarises the group's median scores on each of the 6 domains, then sets out the median scores for each of the Assets that fall under each domain.
The Item Analysis function offers data at the most fine-tuned level. It generates an unfolding table with Items nested under Assets nested under Domains.
Remember that when children answer each of the 57 questions that make up the wellbeing measure in Rumble's Quest, they use a 5-point response scale. The numeric score values assigned to responses range from 0-4. Therefore, the group's mean response to each item can fall anywhere between 0 and 4, and the higher it is, the stronger the group is on that item. The Item Analysis shows the proportion of children in the group who showed high, medium, or low wellbeing in response to each of the individual items associated with each asset within each domain. As a reference guide, the Item Analysis also shows the breakdown of high, medium, and low responses to each item at the national population level. This grey coloured bar offers a useful yardstick when you interpret your results.
1.2 Be Curious and Query as You Go
As you read the data in the Group Wellbeing Profile:
Note variations in the profile:
Look across the six wellbeing domains - are any areas relatively higher or lower than others?
Is this something you expected?
Look at how your group is tracking on each domain compared to the norming benchmarks:
Are there areas where the group is showing strong performance and flying above the benchmark range?
Is the group score sitting inside the expected range (indicating that in general they are doing ok)?
Are there any domains where the group score falls below the norming benchmark? These may be earmarked as areas for potential improvement.
When looking at the Wellbeing Continuum:
Do most children fall in the lightest and mid-blue bands of the six wellbeing bars? (Your future support plans can aim to help children rise to these strong and coping levels.)
Is the percentage of children in the darker blue band that indicates they may be struggling higher than you expected or hoped on any domain? Ask why and start thinking about what might be done to address this.
Does the distribution of children falling within each band of the continuum vary across the wellbeing dimensions?
As you review patterns within the overall group, think about questions you may have about sub-groups of children. For example:
Are there age or gender differences in the filtered wellbeing profiles that you may like to address? (For example, are there areas where girls tend to score higher than boys, or vice versa.)
Does filtering by grade level uncover any systematic patterns such as a dip or blip at a particular age, or the onset of a rise or fall in scores on any domain as children advance through the years?
Taking the time to uncover the patterns within your group data can provide a useful guide to the way you structure your plans to take responsive action tailored to the children's needs.
When reading Child Reports:
Note whether a child has any marked variation across scores in their profile as this may help identify specific areas where they are finding things particularly difficult.
Children who receive high scores on several domains are showing signs of flourishing
Children who receive low scores on one or more of the domains may be revealing early signs that all is not well. Domains and assets where scores are particularly low may point to issues a child is struggling with, and act as a guide to the kind of gentle reassurance and support that could make a real difference for them.
As you read the data in your Asset Analysis reports:
Look at the median for each of the 13 assets. Are there any marked variations between them? Which are high? Which are low?
Note the percentages of low, medium, and high responses made by the group to items within each asset
Look at the average response made by the group to each item within each asset (shown in the item-by-item breakdown areas). Do any items stand out with particularly high or low mean scores?
Also look at the percentage of answers that fell within each response category for each of the items. Are there any items (or groups of items) where the frequency of responses indicating poorer wellbeing (the darker shades) is relatively high? Had you expected to see the patterns you observe?
Look for variation between the Assets that nest within each domain to tease out patterns in your data even further. For example, when you are looking at the composition of items within the Connection to School and Learning domain, does the group score similarly on each of the assets nested under that domain (i.e, Enjoys School; Engaged in Learning; Learning Climate)? Or does the group post high scores on one asset but low scores on another? The direction of the subsequent action you plan in response to your data could vary considerably depending on which pattern you see as you drill down layer by layer.
A note on the potential influence of organisational context on data use:
There is likely to be some variation between the way reports are used at schools versus child support agencies.
Agencies may move quite rapidly to the Child Reports section of their results since the nature of casework means that therapists may experience a more immediate need to review individual children's scores.
At schools, however, the intention is not to expect individual teachers to make independent decisions about what action to take on behalf of individual children in their class. Schools will more appropriately take a broader view and assign a wellbeing team with prime responsibility for exploring the data and considering what patterns and common themes are evident in the group results before they move downstream to individual level. The school wellbeing oversight team can then guide a school-wide approach and lead the development of a whole school wellbeing strategy. Part of this would be to identify both universal and targeted activities that might be implemented to best effect for all students. This tactical approach allows the Rumble's Quest data to be used to guide decisions at all levels at the school in a consistent way (including, if necessary, providing classroom teachers with advice on how to support individual children in their class).
1.3 Record Your Observations
As you work through each section of your report with your wellbeing team, think about what stands out. Use a structured approach to guide your discussion and observations. It may help to ask yourselves some simple questions such as:
What patterns do we notice?
What are the most encouraging - strongest results?
What are the most concerning - least strong results?
What results were we surprised to see?
What do the results suggest we are doing well?
What can we do to sustain and improve these initiatives?
What else might we do?
You may find it helpful to use a Disciplined Dialogue approach as a frame for documenting your analyses, and as you position yourself to move from exploring the results to the next step of developing an action plan for improvement.
The Disciplined Dialogue approach involves using three questions to guide discussion:
Question 1: What is the data showing us? (Review) Question 2: Why are we seeing this? (Theorise) Question 3: What are we going to do about it? (Plan – this question kicks off Step 2)
Here's a simple Data Enquiry Record Sheet that follows the Disciplined Dialogue model. You can use it to record the insights that emerge from your team discussions.
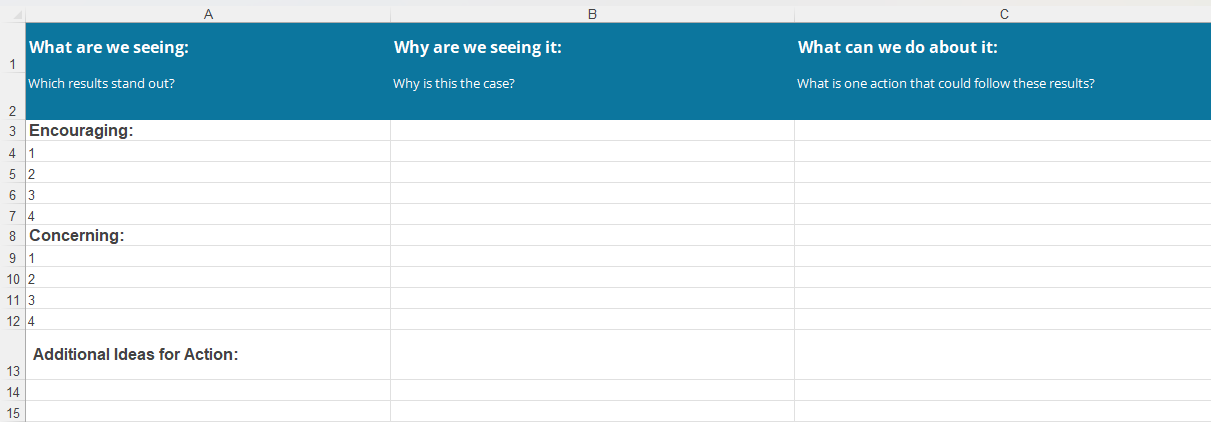
To complete the first column of the Data Enquiry Record Sheet, ask: Which results stand out? What are the data telling us? Look for patterns in the scores, identify areas of strength and challenge. Choose a small number of encouraging and concerning issues that stand out in your results (maybe there is an asset or a couple of item scores linked to some of the wellbeing domains that capture your attention).
To complete the second column, ask: Why is this the case? Why are we seeing this? Contextualise the data – think about any recent events or conditions in the school, community, or a child's family life that may be influencing children's feelings and reflect on possible connections between those contextual factors and the things you are seeing in the data.
When you reach column 3, it's time to move to Step 2 and plan a course of action, so ask: What action can we take here? What are we going to do about this? Which standout issues would you like to prioritise? What kinds of initiatives could you undertake to address each of these issues.